The energetic activity of the Sun shows a rather stable cycle of about 11 years. As a measure of this activity, it is popular to take the number of sunspots observed on the surface of the Sun on any given day. Over the last few decades, this number has looked like what is seen on the ISES chart here below:
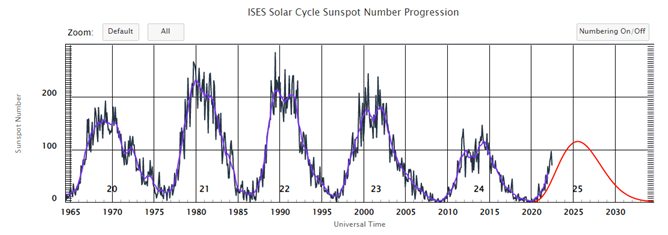
Here we see the real observed number of sunspots during cycles 20 through 24, and we also see the prediction of the progress of the current cycle 25, shown with the red line. However, the numbers of sunspots observed in the last two years are increasing much more steeply than the scientists predict. Early prediction of solar activity is not easy. It has even become an art because in traditional astrophysics has no theory that could describe this activity. On the other hand, the observation of the solar activity has become very important in the last decades because, after all, the activity of the Sun is assumed to be related to the variations of the global climate of the Earth. I have explained what is wrong and what is right about this assumption in my earlier post here ("ET6. Sunspots have no influence on Earth's climate.").
But now let's demonstrate the strength of my Unified Science by presenting the forecast not only for the current solar cycle 25, but also for the next cycle 26. No scientist of the world has managed this until today.
NASA's prediction for cycle 25 can be seen in this diagram:
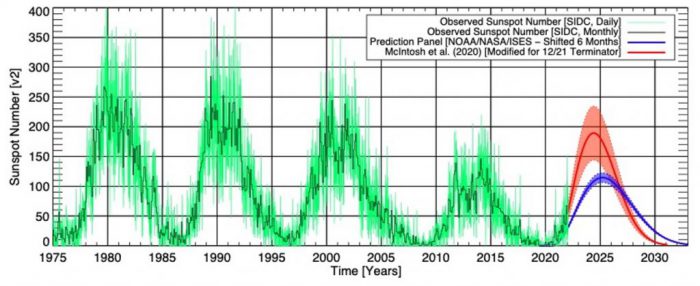
The currently observed rapid increase in the number of sunspots has even motivated some scientists to suspect much greater solar activity (the red curve here above). In my opinion, such a conjecture is quite wrong. The maximum number of sunspots in this cycle will hardly exceed the mark of 120. The Sun is more likely to go into a "cosmic sleep" in the next decades. This assertion of mine is based on the calculation of the energetic activity of the Cosmic Hierarchy of the Solar System during the last millennia. The newest part of these calculations can be seen graphically at the following diagram (the links to my books can be found on the home page of this website):
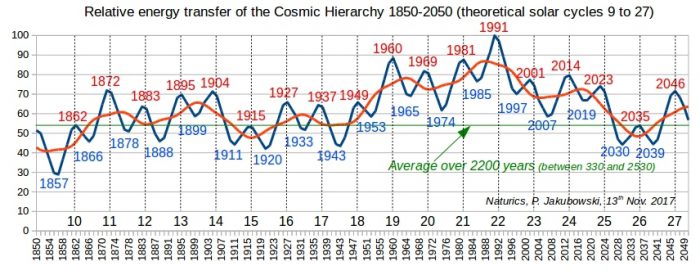
(Remark to this diagram: the blue curve is the calculated relative activity of the Cosmic Hierarchy averaged over one solar cycle, the red curve is the same activity averaged over three such cycles.)
According to this calculation, the prediction of ISES (from the first diagram here above) must rather be understood in the way that the maximum of cycle 25 has already taken place this winter, as shown here below:
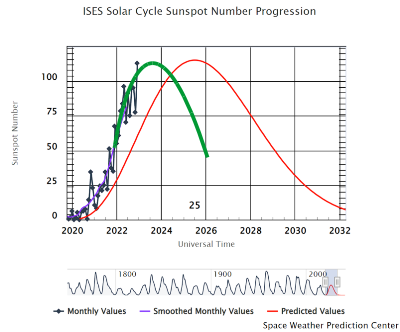
Accordingly, the minimum of solar activity between cycles 25 and 26 will also be reached much earlier than in 2033, namely in 2029, as predicted here below:
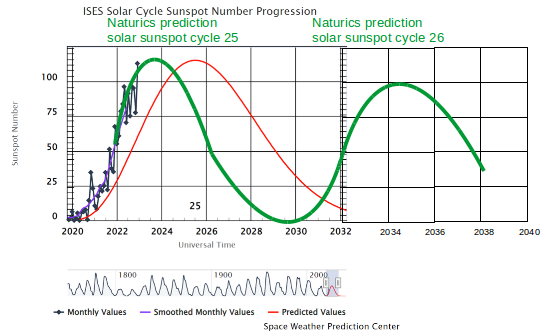
The activity of the Sun will be much lower in the next decades than in the last decades of the 20th century. It will not cause yet a new ice age on Earth, but it will become globally clearly colder. The Sun goes to sleep!
The update of the observation till 29th December 2023 is as follows.
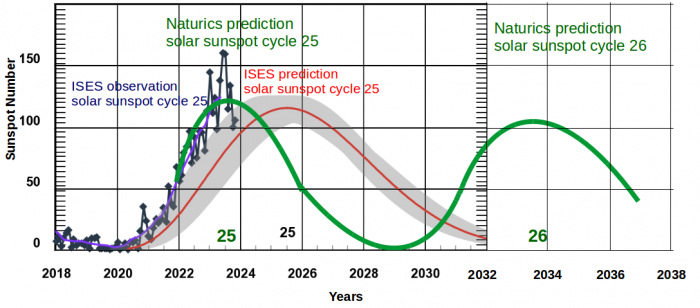
“The Sun goes to sleep!”
What a wakeup call!
While most of the world is in migration-agitation about shrinking habitable land masses due to (among other climate shifts) increasingly scorching temperatures, the global game of musical chairs might be headed in the wrong direction!
If it’s true that the temperatures will soon be cooling, is that equally distributed across all land masses or will some areas be more vulnerable to colder temperature fluctuations than others?
And what of the arctic meltdown? Is that accelerating faster than the pace of the global cooling (and could that cooling influence any further melting or will that be too late)?
And another hot topic: what of the Little Ice Age … is it gonna become a very “cool” new world anytime soon?
Thank you, Peter Nature, for helping Human Nature!